6-K: Report of foreign issuer [Rules 13a-16 and 15d-16]
Published on April 21, 2026
Exhibit 99.2

FY25 Supplemental Investor Presentation April 2026 NYSE: DDC 1
This document ("Document") is being provided to recipients solely for use by potential investors for information purpose and it is not intended to form the basis of any investment decision or any decision in relation to a transaction involving DDC Enterprise Limited (the "Company") and/or any of its subsidiaries and/or affiliates (collectively, the "Group"). By receiving and retaining this Document, the recipient acknowledges and represents to the Group, that you have understood and accepted the terms of this notice. This Document does not constitute an offer to sell or the solicitation of any offer to buy any securities of the Company, nor shall there be any sale of these securities in any state or jurisdiction in which such an offer, solicitation or sale would be unlawful prior to registration or qualification under the securities laws of any such state or jurisdiction. This Document does not constitute or contain an offer or invitation or solicitation for the sale or purchase of securities or any interest in the Group and neither this Document nor anything contained herein shall form the basis of, or be relied upon in connection with, any contract or commitment whatsoever. Neither the information contained in this Document nor any further information made available by the Group or any of its directors, officers, partners, employees, agents, representatives or advisors will form basis of or be construed as a contract or any other legal obligation. The information contained herein and any additional material provided have been prepared to assist interested parties in making their own evaluation of the Group and do not purport to contain all of the information that an interested party may desire or require to evaluate the Group. In all cases, interested parties should conduct their own investigation and analysis of the Group, financial condition and prospects, and of the data set forth in this Document. None of the Group, or its subsidiaries, shareholders or other affiliates, or any of their respective directors, officers, partners, employees, agents, representatives or advisors, make any representation or warranty, express or implied, as to the accuracy or completeness of this Document or the information contained in, or for any omissions from, this Document or any other written or oral communications transmitted to the recipient in the course of its evaluation of the Group. Only those particular representations and warranties, if any, which may be made to a party in a definitive written agreement, when, as and if executed, and subject to such limitations and restrictions as may be specified therein, will have any legal effect. In furnishing this Document, the Group does not undertake any obligation to provide the recipient with access to any additional information or to update this Document or to correct any inaccuracies therein which may become apparent. This Document shall neither be deemed an indication of the state or affairs of the Group nor constitute an indication that there has been no change in the state or affairs of the Group since the date thereof or since the dates as of which information is given in the Document. This Document contains certain statements, estimates, targets, forecasts and projections with respect to the Group, including certain financial forecasts. Any such information is subjective and would necessarily be prepared based upon certain assumptions and analysis of information available at the relevant time and may not prove to be correct. Accordingly, there is no representation, warranty or assurance of any kind, express or implied, that any such information will be correct or that any such statements, estimates, targets, forecasts or projections will be realized. This Document may also contain forward-looking statements. All statements other than statements of historical fact are statements that could be forward-looking statements. You can identify these forward looking statements through the use of words such as "may," "will," "can," "anticipate," "assume," "should," "indicate," "would," "believe," "contemplate," "expect," "seek," "estimate," "continue," "plan," "point to," "project," "predict," "could," "intend," "target," "potential" and other similar words and expressions of the future. For example, our Bitcoin discussion includes a number of forward-looking statements, such as our ability to borrow or raise capital to acquire Bitcoin, the future value of Bitcoin, our ability to close transactions previously announced or in the future to acquire Bitcoin, security of our Bitcoin holdings, our ability to issue our shares to acquire Bitcoin and related regulatory filings with the NYSE and SEC. These forward-looking statements are subject to risks and uncertainties that may cause actual future experience and results to differ materially from those discussed in these forward looking statements. Important factors that might cause such a difference include, but are not limited to, the timing, cost and uncertainty of the Group's business initiatives and the Group's ability to develop and monetize its business. None of the members of the Group undertake any obligation to release any revisions to such forward-looking statements to reflect events or circumstances after the date hereof or to reflect the occurrence of unanticipated events. Disclaimer
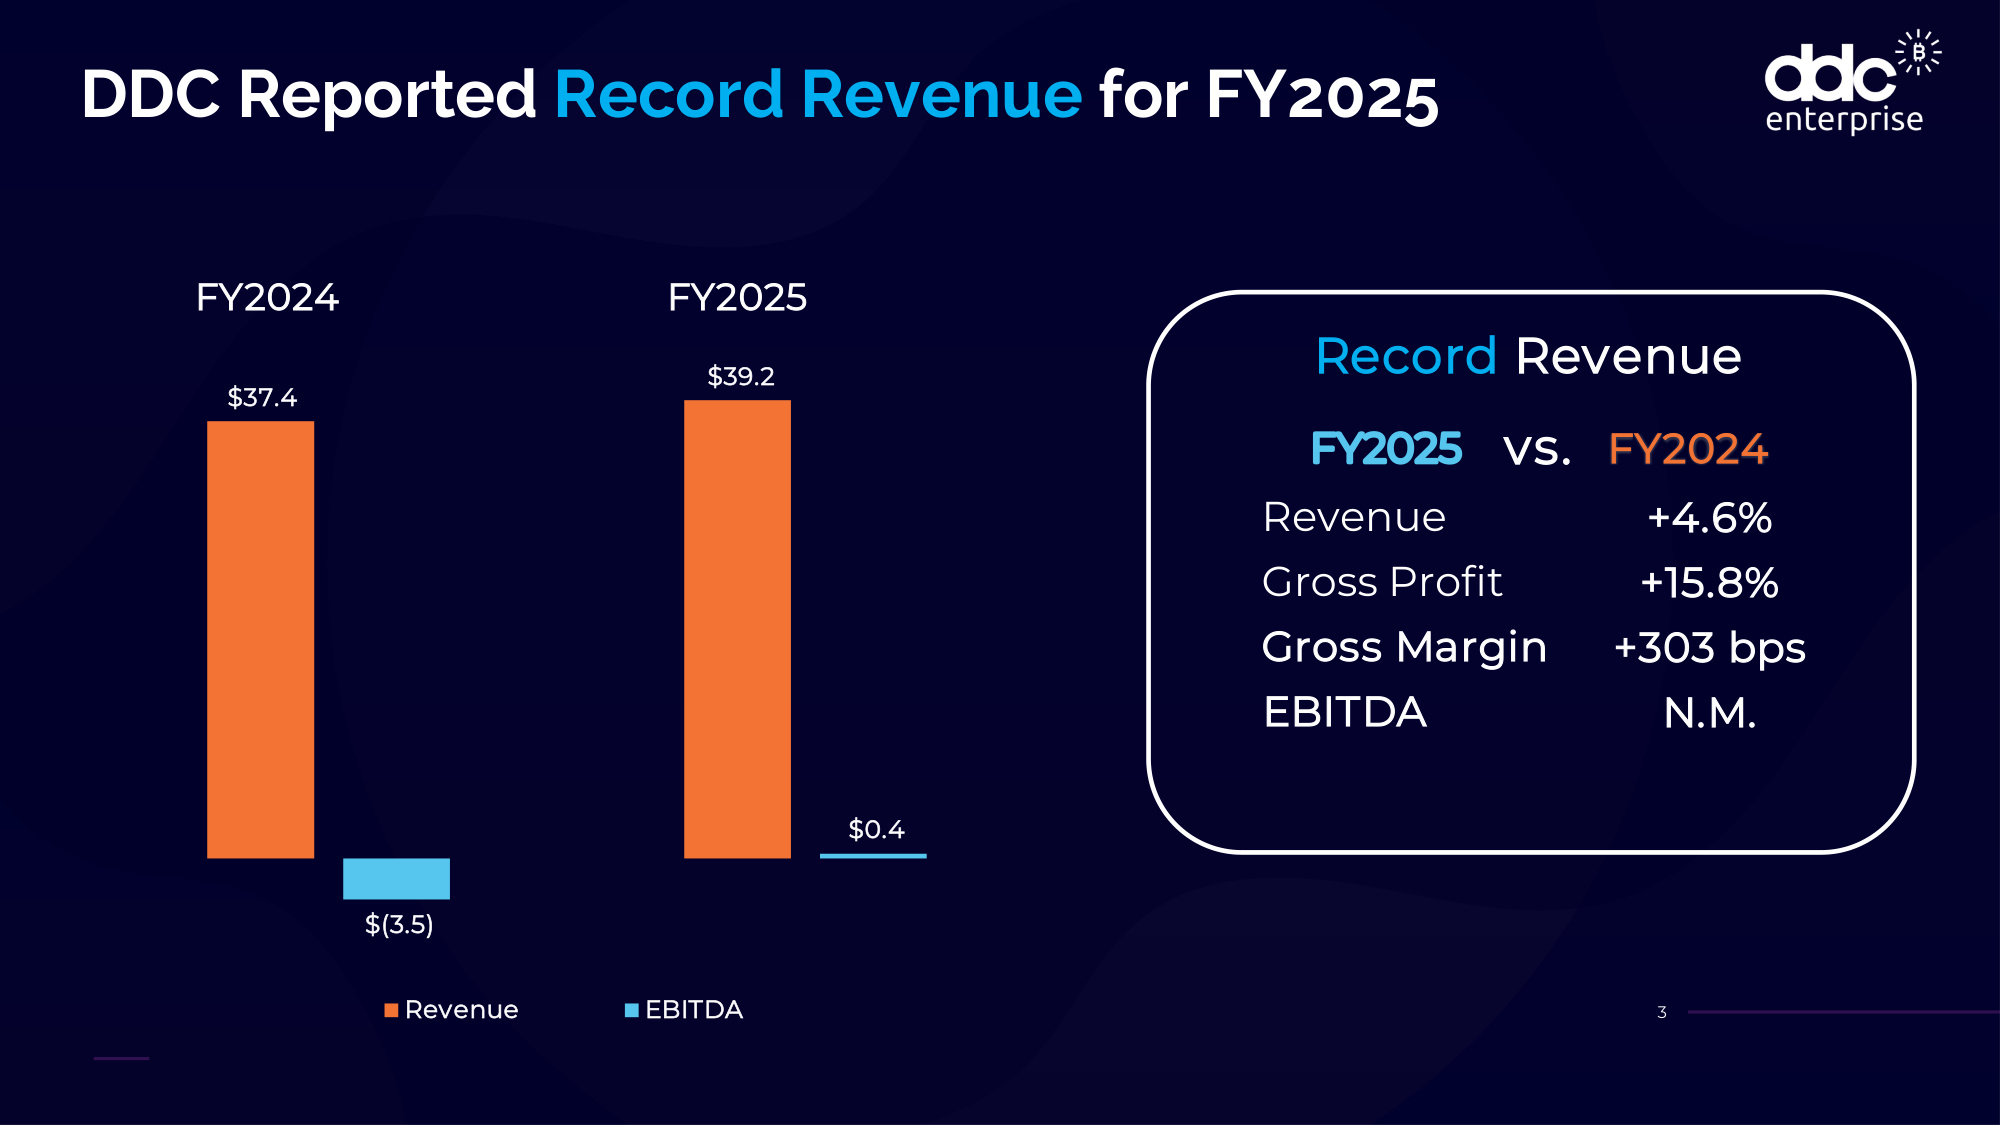
vs. Revenue +4.6% Gross Profit +15.8% Gross Margin +303 bps EBITDA N.M. FY2025 FY2024 $37.4 $39.2 $(3.5) $0.4 Revenue EBITDA Record Revenue 3 DDC Reported Record Revenue for FY2025 FY2024 FY2025
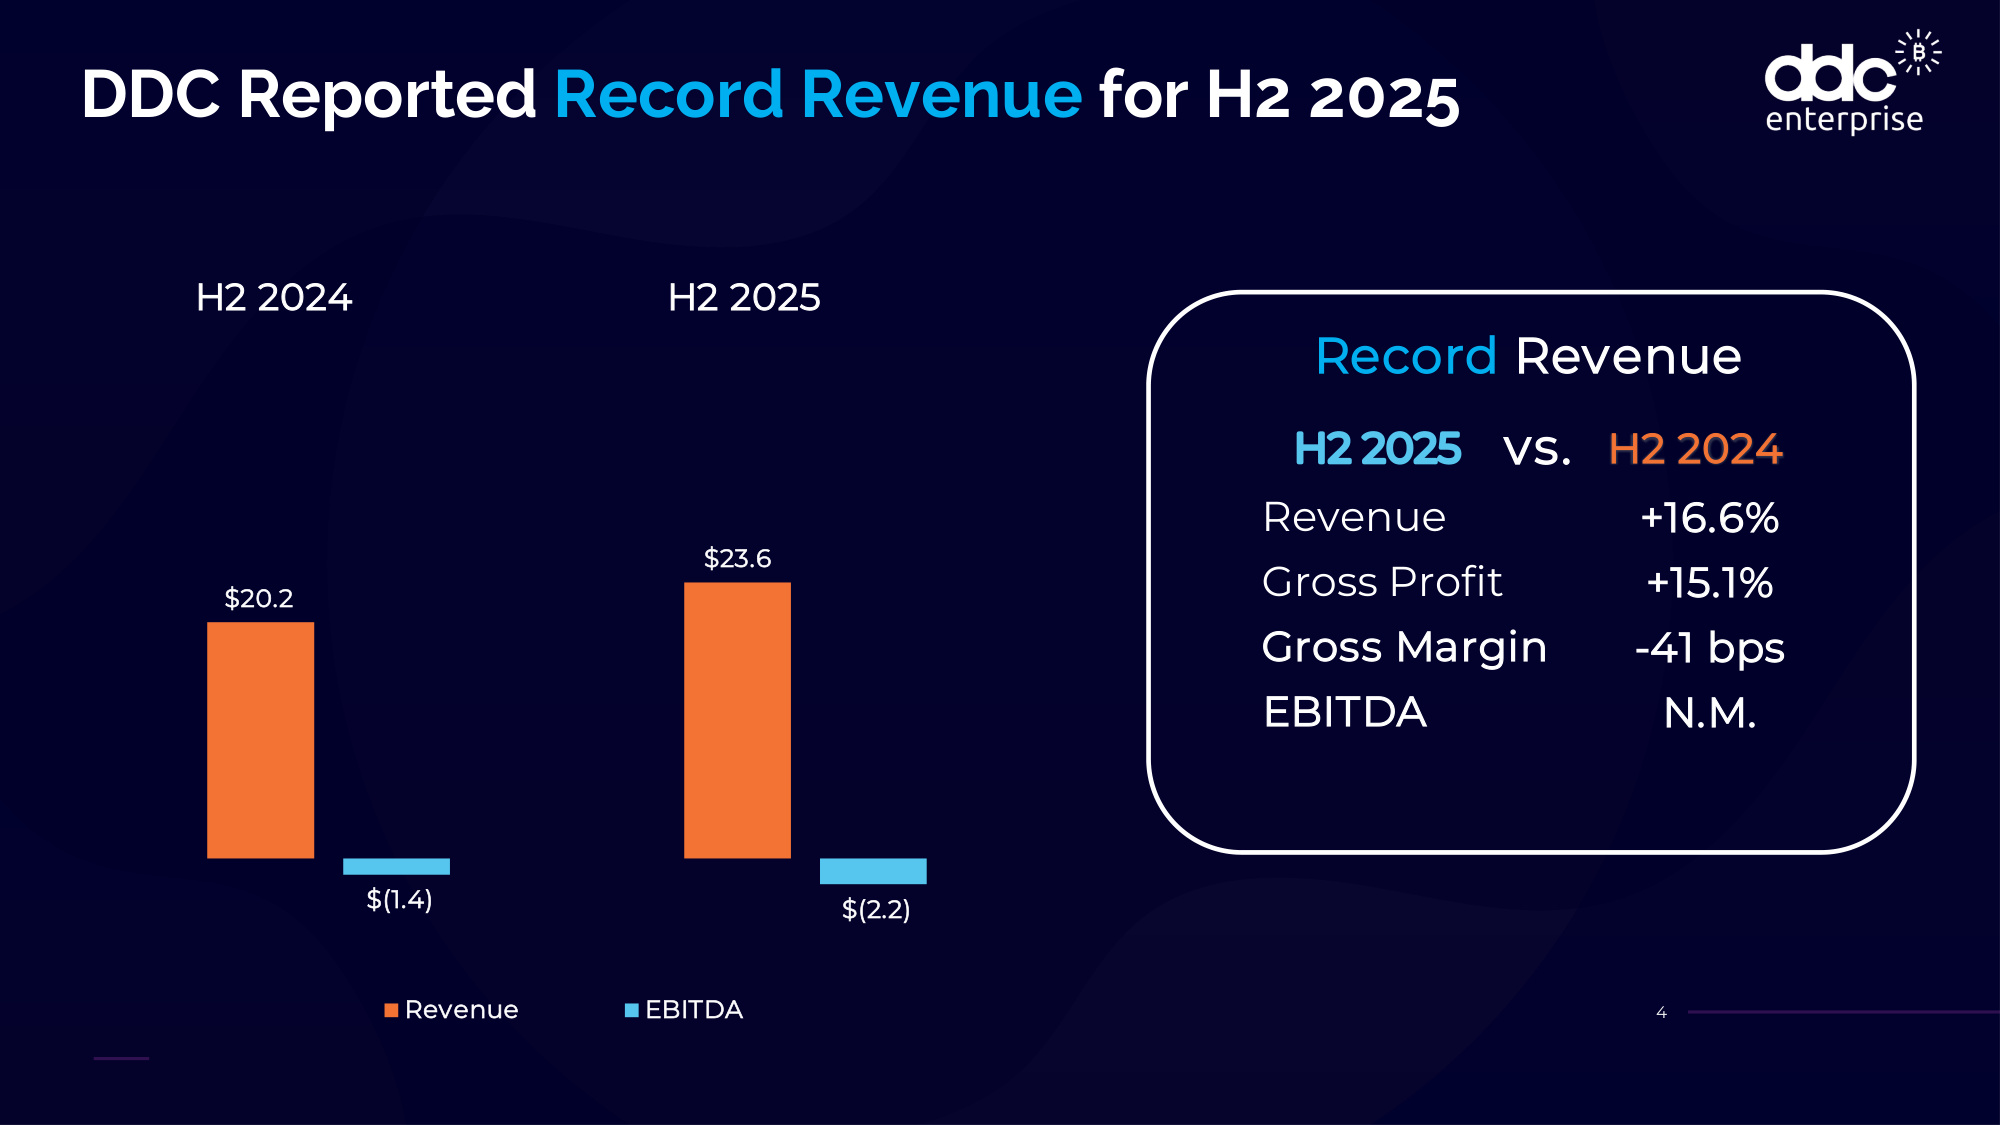
vs. Revenue +16.6% Gross Profit +15.1% Gross Margin -41 bps EBITDA N.M. H2 2025 H2 2024 $20.2 $23.6 $(1.4) $(2.2) Revenue EBITDA Record Revenue 4 DDC Reported Record Revenue for H2 2025 H2 2024 H2 2025
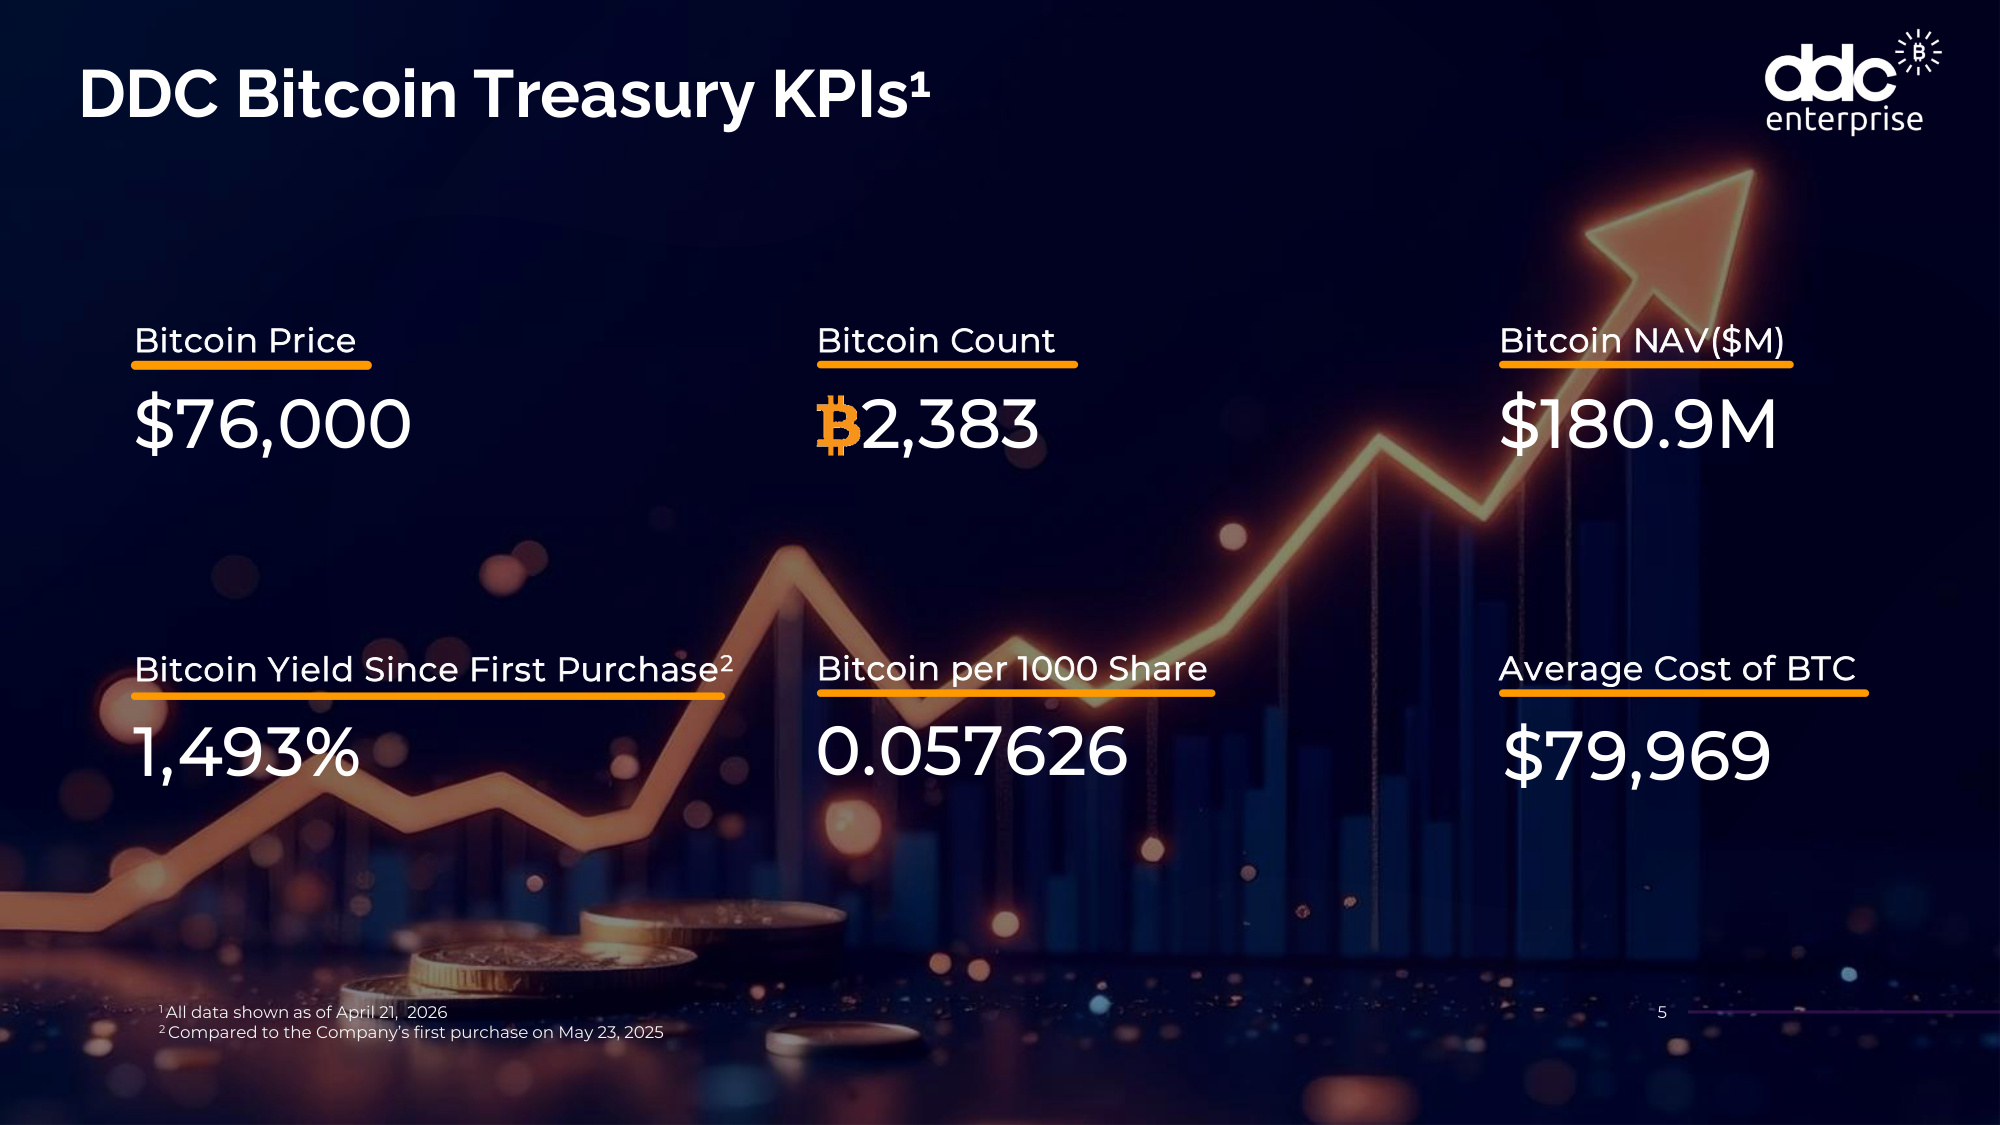
$76,000 2,383 $180.9M 1,493% 0.057626 $79,969 Bitcoin Price Bitcoin Count Bitcoin NAV($M) Bitcoin Yield Since First Purchase2 Bitcoin per 1000 Share Average Cost of BTC DDC Bitcoin Treasury KPIs1 5 1 All data shown as of April 21, 2026 2 Compared to the Company's first purchase on May 23, 2025

Outlook 6 Continue to grow core business in higher-margin markets, while maintaining discipline around costs and improving cash conversion. Continue to execute our Bitcoin treasury strategy in a measured and strategic manner. Explore selective, risk-managed opportunities to generate yield on Bitcoin holdings, with a focus on capital preservation, high-quality counterparties, and disciplined risk management. Expand capital allocation capabilities through structured opportunities that complement the DDC's treasury strategy and further differentiate its platform.
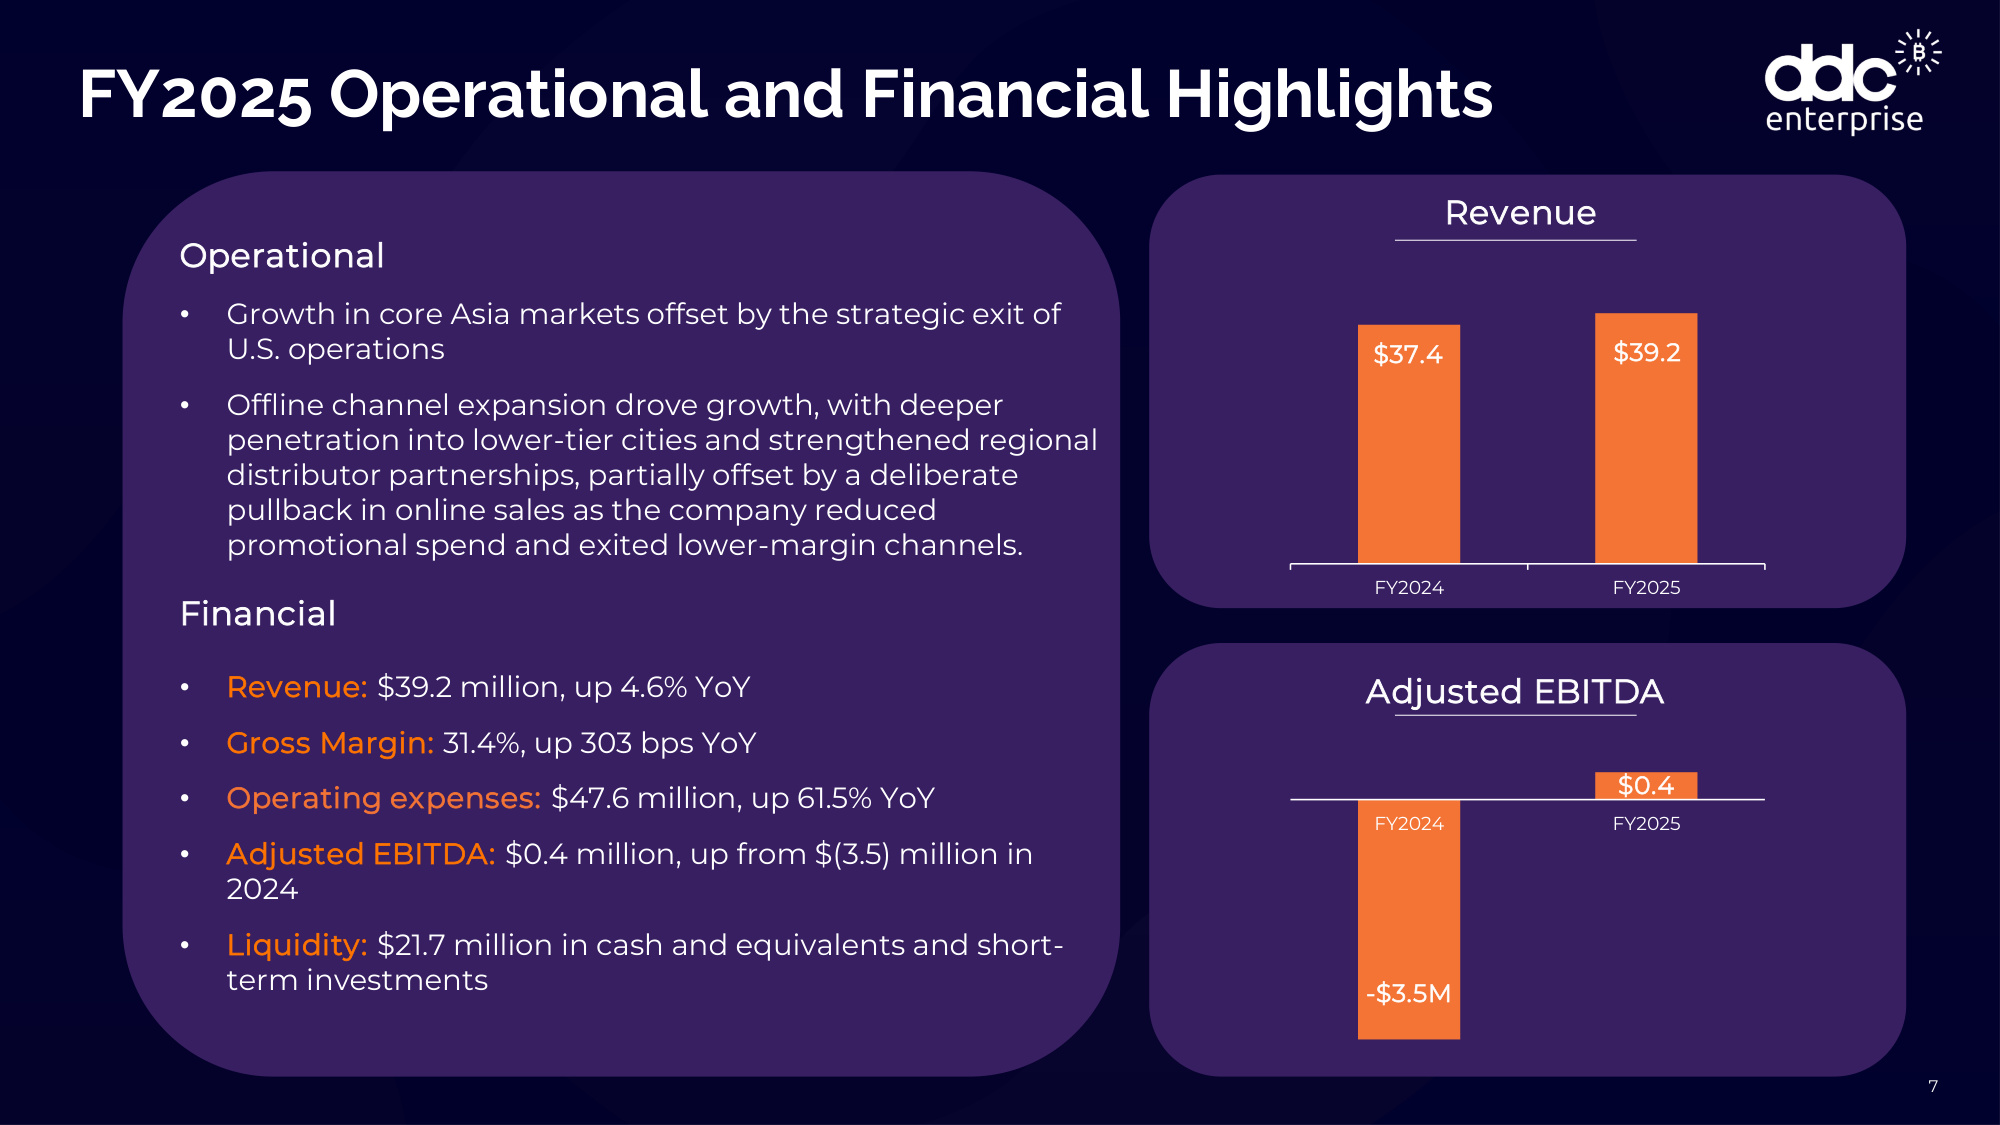
FY2025 Operational and Financial Highlights 7 Operational • Growth in core Asia markets offset by the strategic exit of U.S. operations • Offline channel expansion drove growth, with deeper penetration into lower-tier cities and strengthened regional distributor partnerships, partially offset by a deliberate pullback in online sales as the company reduced promotional spend and exited lower-margin channels. Financial • Revenue: $39.2 million, up 4.6% YoY • Gross Margin: 31.4%, up 303 bps YoY • Operating expenses: $47.6 million, up 61.5% YoY • Adjusted EBITDA: $0.4 million, up from $(3.5) million in 2024 • Liquidity: $21.7 million in cash and equivalents and short- term investments Revenue $37.4 $39.2 FY2024 FY2025 Adjusted EBITDA -$3.5M $0.4 FY2024 FY2025
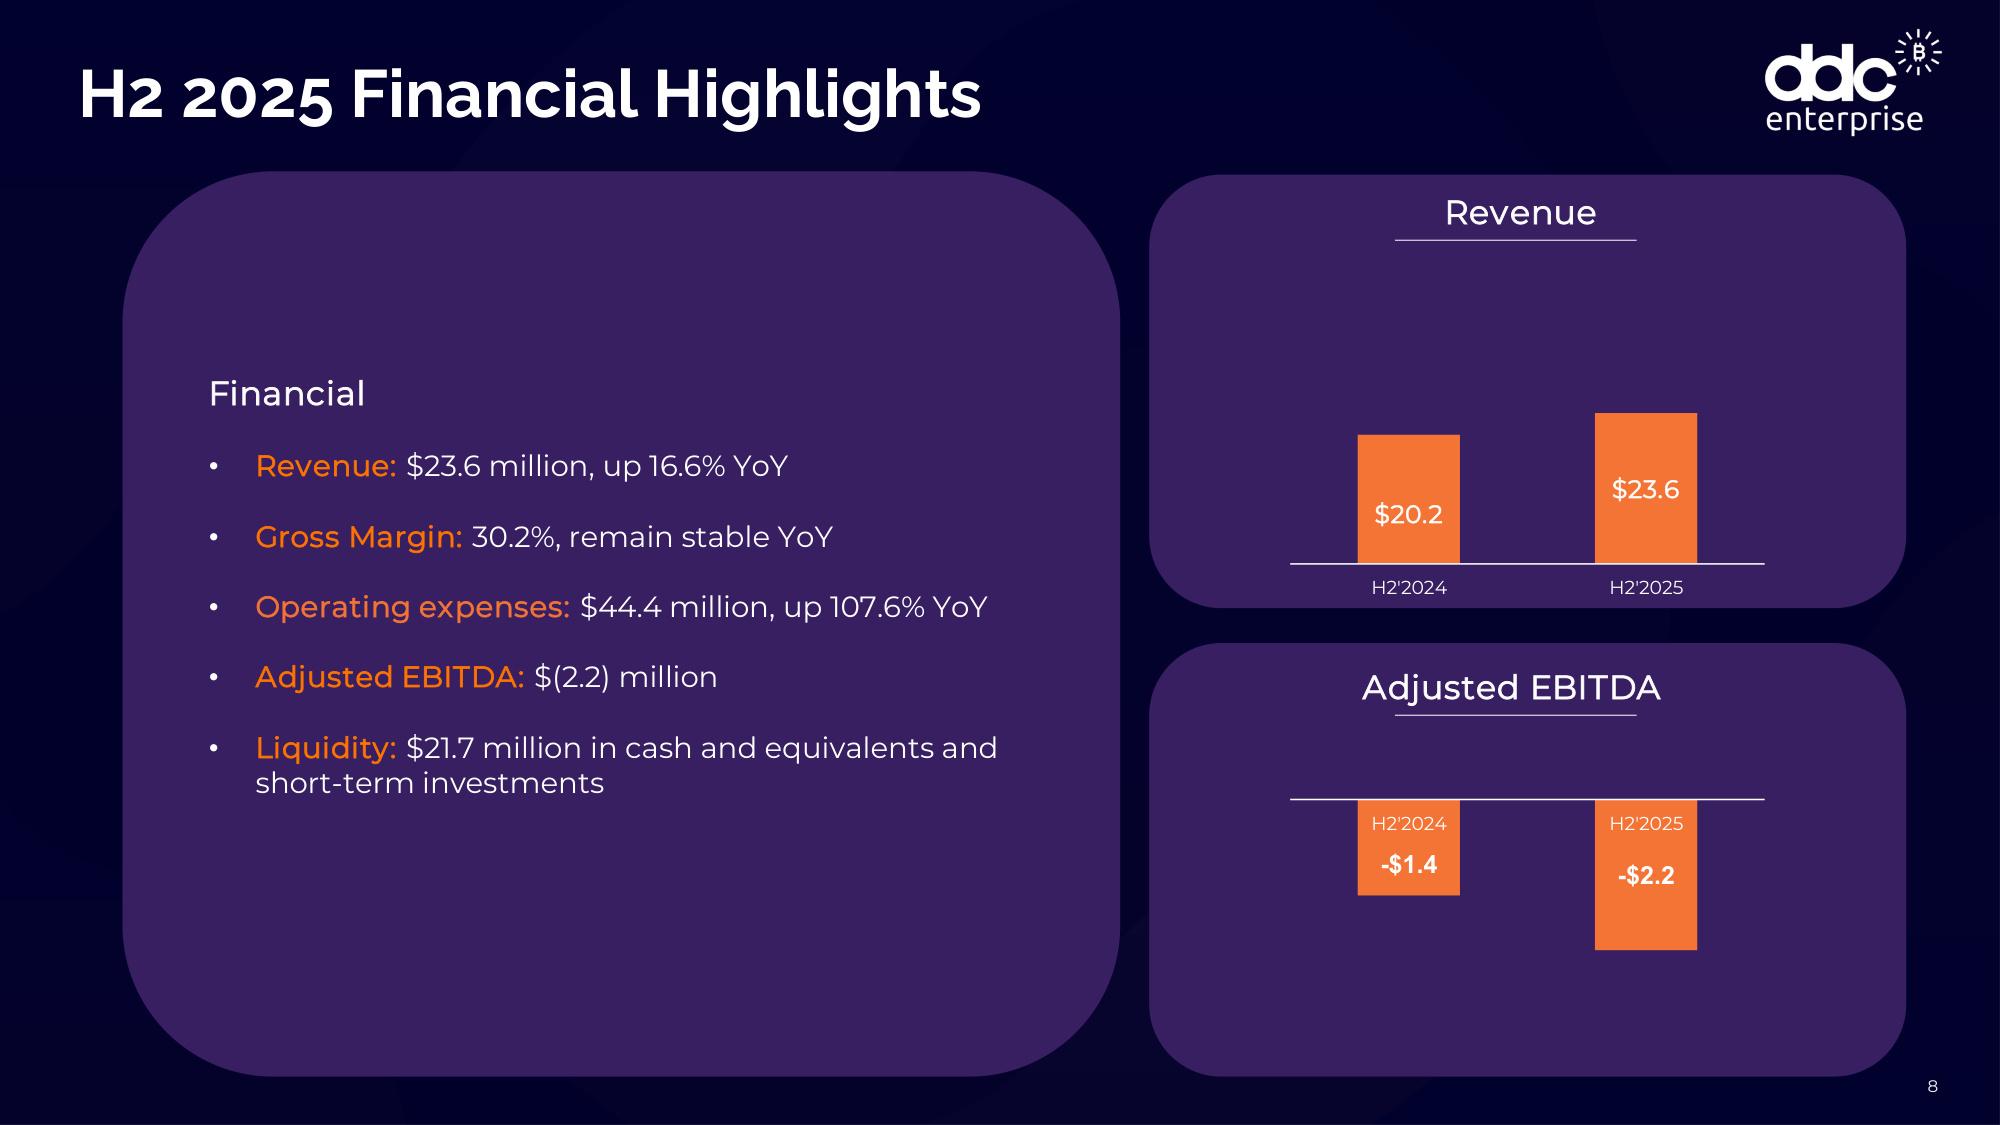
H2 2025 Financial Highlights 8 Financial • Revenue: $23.6 million, up 16.6% YoY • Gross Margin: 30.2%, remain stable YoY • Operating expenses: $44.4 million, up 107.6% YoY • Adjusted EBITDA: $(2.2) million • Liquidity: $21.7 million in cash and equivalents and short-term investments Revenue Adjusted EBITDA $20.2 $23.6 H2'2024 H2'2025 -$1.4 -$2.2 H2'2024 H2'2025
FY 2025 Capital Market Highlights Financial • Closed an aggregate of $528 million in strategic financing for Bitcoin treasury strategy: • $26 million strategic PIPE investment from premier Bitcoin and digital asset investors, which included conversion of outstanding debt to further strengthen the balance sheet. • $25 million by issuance of first tranche of convertible notes (with committed additional capacity of up to $275 million available in subsequent drawdowns) with Anson Funds. • $2 million in a private placement from Anson Funds in addition to a $200 million equity line of credit. • Filed a $500 million universal shelf registration statement on Form F-3 with the U.S. Securities and Exchange Commission (SEC). • Secured a $124 million equity financing round at $10.00 per Class A share, led by PAG Pegasus Fund and Mulana Investment Management with a $3 million personal investment from Founder and CEO Norma Chu. 9

Appendix 10
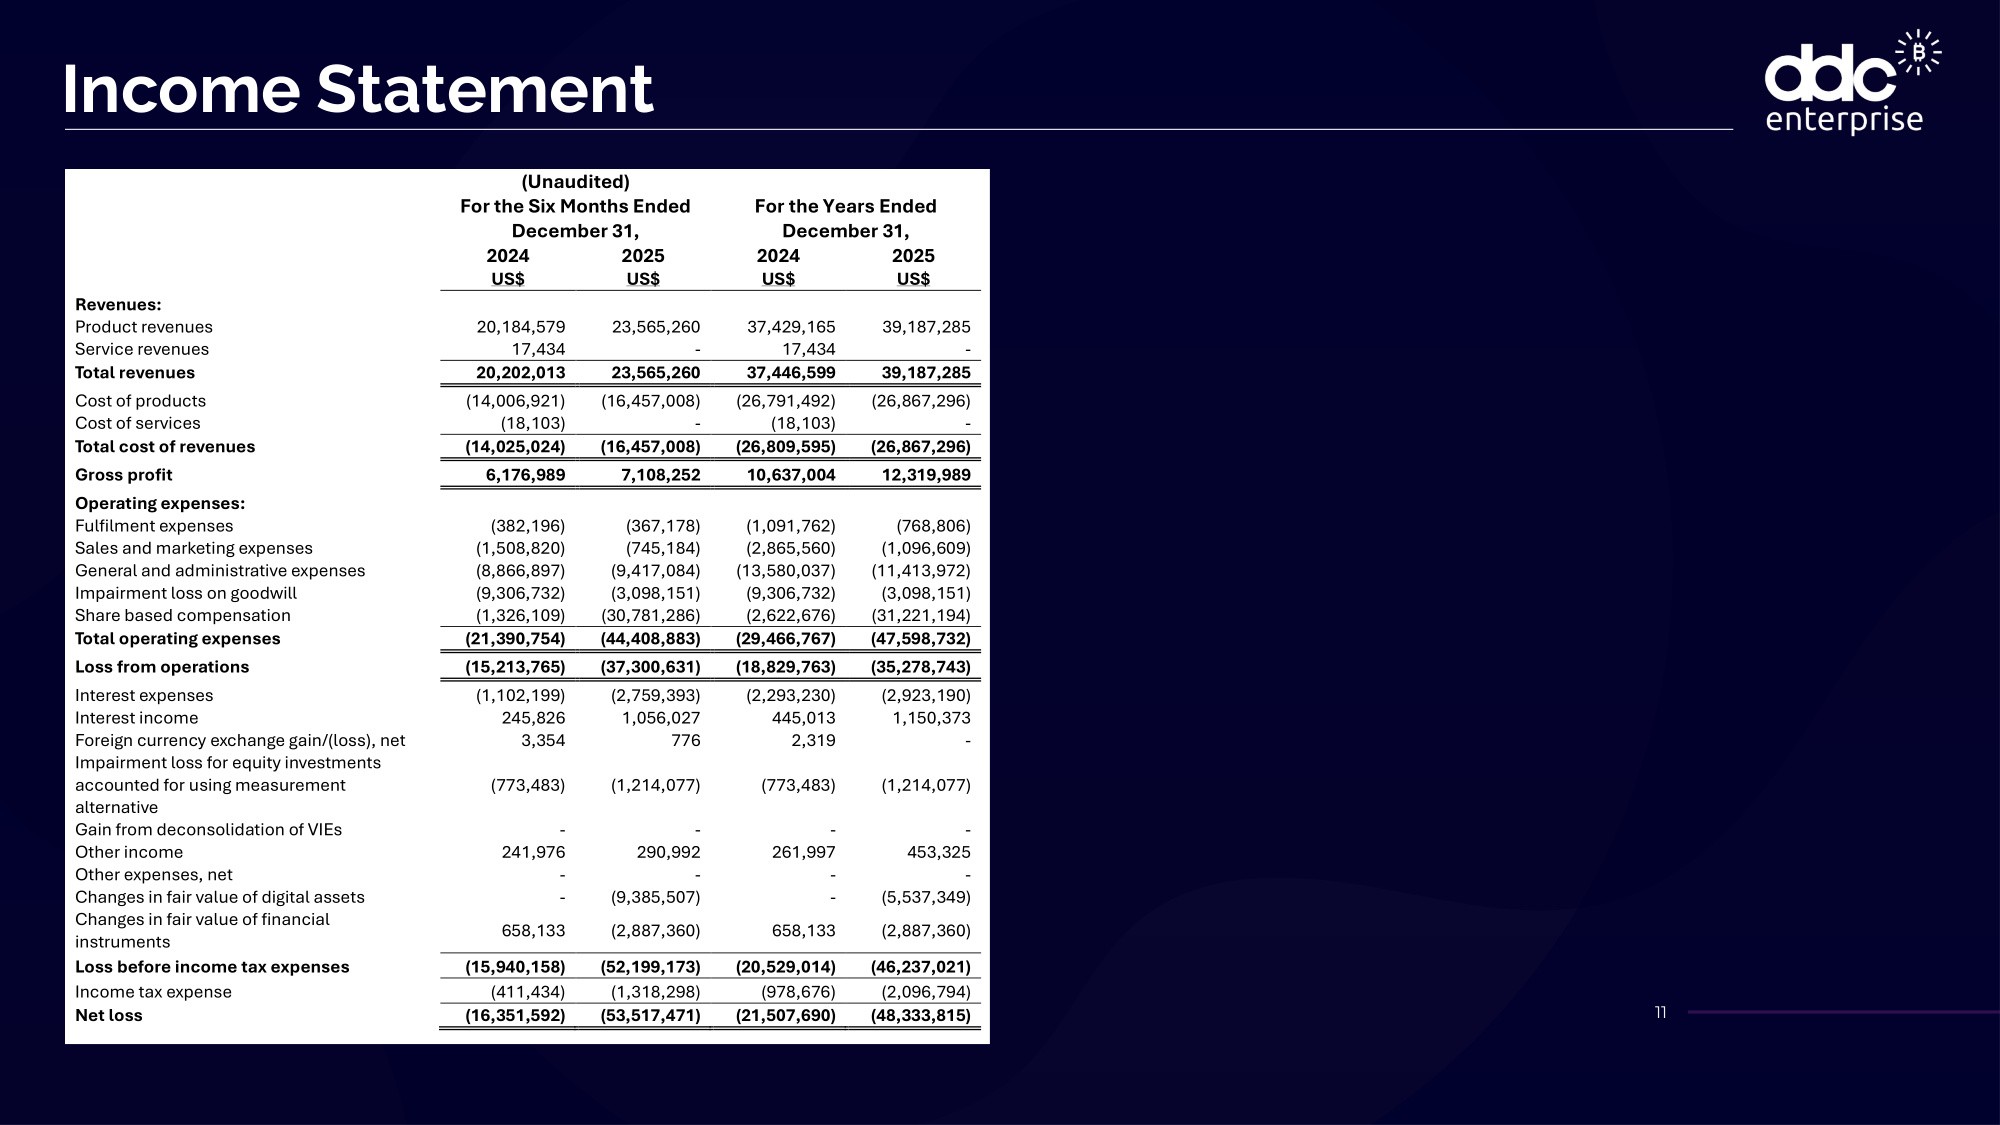
Income Statement 11 (Unaudited) For the Six Months Ended December 31, For the Years Ended December 31, 2024 2025 2024 2025 US$ US$ US$ US$ Revenues: Product revenues 20,184,579 23,565,260 37,429,165 39,187,285 Service revenues 17,434 - 17,434 - Total revenues 20,202,013 23,565,260 37,446,599 39,187,285 Cost of products (14,006,921) (16,457,008) (26,791,492) (26,867,296) Cost of services (18,103) - (18,103) - Total cost of revenues (14,025,024) (16,457,008) (26,809,595) (26,867,296) Gross profit 6,176,989 7,108,252 10,637,004 12,319,989 Operating expenses: Fulfilment expenses (382,196) (367,178) (1,091,762) (768,806) Sales and marketing expenses (1,508,820) (745,184) (2,865,560) (1,096,609) General and administrative expenses (8,866,897) (9,417,084) (13,580,037) (11,413,972) Impairment loss on goodwill (9,306,732) (3,098,151) (9,306,732) (3,098,151) Share based compensation (1,326,109) (30,781,286) (2,622,676) (31,221,194) Total operating expenses (21,390,754) (44,408,883) (29,466,767) (47,598,732) Loss from operations (15,213,765) (37,300,631) (18,829,763) (35,278,743) Interest expenses (1,102,199) (2,759,393) (2,293,230) (2,923,190) Interest income 245,826 1,056,027 445,013 1,150,373 Foreign currency exchange gain/(loss), net 3,354 776 2,319 - Impairment loss for equity investments accounted for using measurement alternative (773,483) (1,214,077) (773,483) (1,214,077) Gain from deconsolidation of VIEs - - - - Other income 241,976 290,992 261,997 453,325 Other expenses, net - - - - Changes in fair value of digital assets - (9,385,507) - (5,537,349) Changes in fair value of financial instruments 658,133 (2,887,360) 658,133 (2,887,360) Loss before income tax expenses (15,940,158) (52,199,173) (20,529,014) (46,237,021) Income tax expense (411,434) (1,318,298) (978,676) (2,096,794) Net loss (16,351,592) (53,517,471) (21,507,690) (48,333,815)
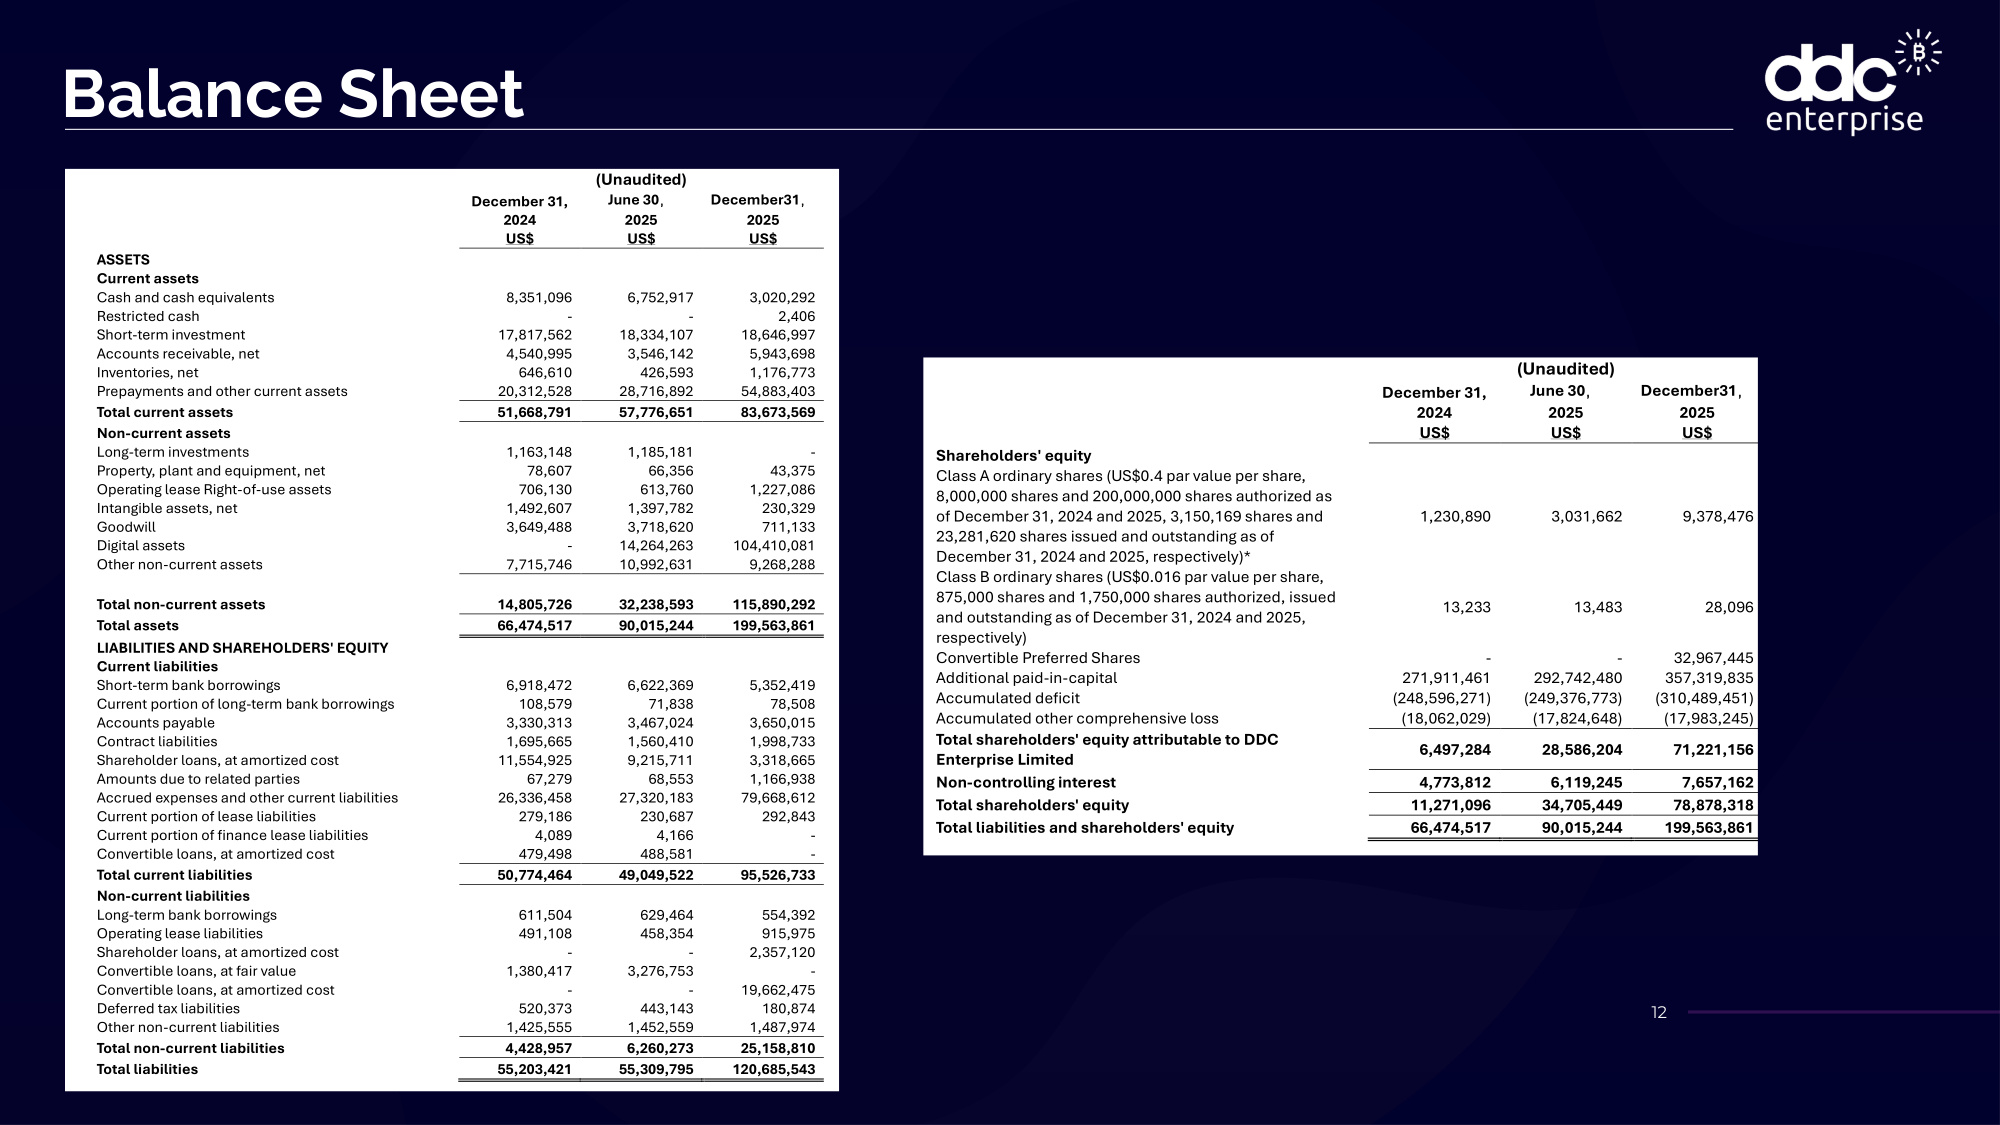
Balance Sheet 12 December 31, (Unaudited) June 30, December31, 2024 2025 2025 US$ US$ US$ ASSETS Current assets Cash and cash equivalents 8,351,096 6,752,917 3,020,292 Restricted cash - - 2,406 Short-term investment 17,817,562 18,334,107 18,646,997 Accounts receivable, net 4,540,995 3,546,142 5,943,698 Inventories, net 646,610 426,593 1,176,773 Prepayments and other current assets 20,312,528 28,716,892 54,883,403 Total current assets 51,668,791 57,776,651 83,673,569 Non-current assets Long-term investments 1,163,148 1,185,181 - Property, plant and equipment, net 78,607 66,356 43,375 Operating lease Right-of-use assets 706,130 613,760 1,227,086 Intangible assets, net 1,492,607 1,397,782 230,329 Goodwill 3,649,488 3,718,620 711,133 Digital assets - 14,264,263 104,410,081 Other non-current assets 7,715,746 10,992,631 9,268,288 Total non-current assets 14,805,726 32,238,593 115,890,292 Total assets 66,474,517 90,015,244 199,563,861 LIABILITIES AND SHAREHOLDERS' EQUITY Current liabilities Short-term bank borrowings 6,918,472 6,622,369 5,352,419 Current portion of long-term bank borrowings 108,579 71,838 78,508 Accounts payable 3,330,313 3,467,024 3,650,015 Contract liabilities 1,695,665 1,560,410 1,998,733 Shareholder loans, at amortized cost 11,554,925 9,215,711 3,318,665 Amounts due to related parties 67,279 68,553 1,166,938 Accrued expenses and other current liabilities 26,336,458 27,320,183 79,668,612 Current portion of lease liabilities 279,186 230,687 292,843 Current portion of finance lease liabilities 4,089 4,166 - Convertible loans, at amortized cost 479,498 488,581 - Total current liabilities 50,774,464 49,049,522 95,526,733 Non-current liabilities Long-term bank borrowings 611,504 629,464 554,392 Operating lease liabilities 491,108 458,354 915,975 Shareholder loans, at amortized cost - - 2,357,120 Convertible loans, at fair value 1,380,417 3,276,753 - Convertible loans, at amortized cost - - 19,662,475 Deferred tax liabilities 520,373 443,143 180,874 Other non-current liabilities 1,425,555 1,452,559 1,487,974 Total non-current liabilities 4,428,957 6,260,273 25,158,810 Total liabilities 55,203,421 55,309,795 120,685,543 December 31, (Unaudited) June 30, December31, 2024 2025 2025 US$ US$ US$ Shareholders' equity Class A ordinary shares (US$0.4 par value per share, 8,000,000 shares and 200,000,000 shares authorized as of December 31, 2024 and 2025, 3,150,169 shares and 23,281,620 shares issued and outstanding as of December 31, 2024 and 2025, respectively)* 1,230,890 3,031,662 9,378,476 Class B ordinary shares (US$0.016 par value per share, 875,000 shares and 1,750,000 shares authorized, issued and outstanding as of December 31, 2024 and 2025, respectively) 13,233 13,483 28,096 Convertible Preferred Shares - - 32,967,445 Additional paid-in-capital 271,911,461 292,742,480 357,319,835 Accumulated deficit (248,596,271) (249,376,773) (310,489,451) Accumulated other comprehensive loss (18,062,029) (17,824,648) (17,983,245) Total shareholders' equity attributable to DDC Enterprise Limited 6,497,284 28,586,204 71,221,156 Non-controlling interest 4,773,812 6,119,245 7,657,162 Total shareholders' equity 11,271,096 34,705,449 78,878,318 Total liabilities and shareholders' equity 66,474,517 90,015,244 199,563,861
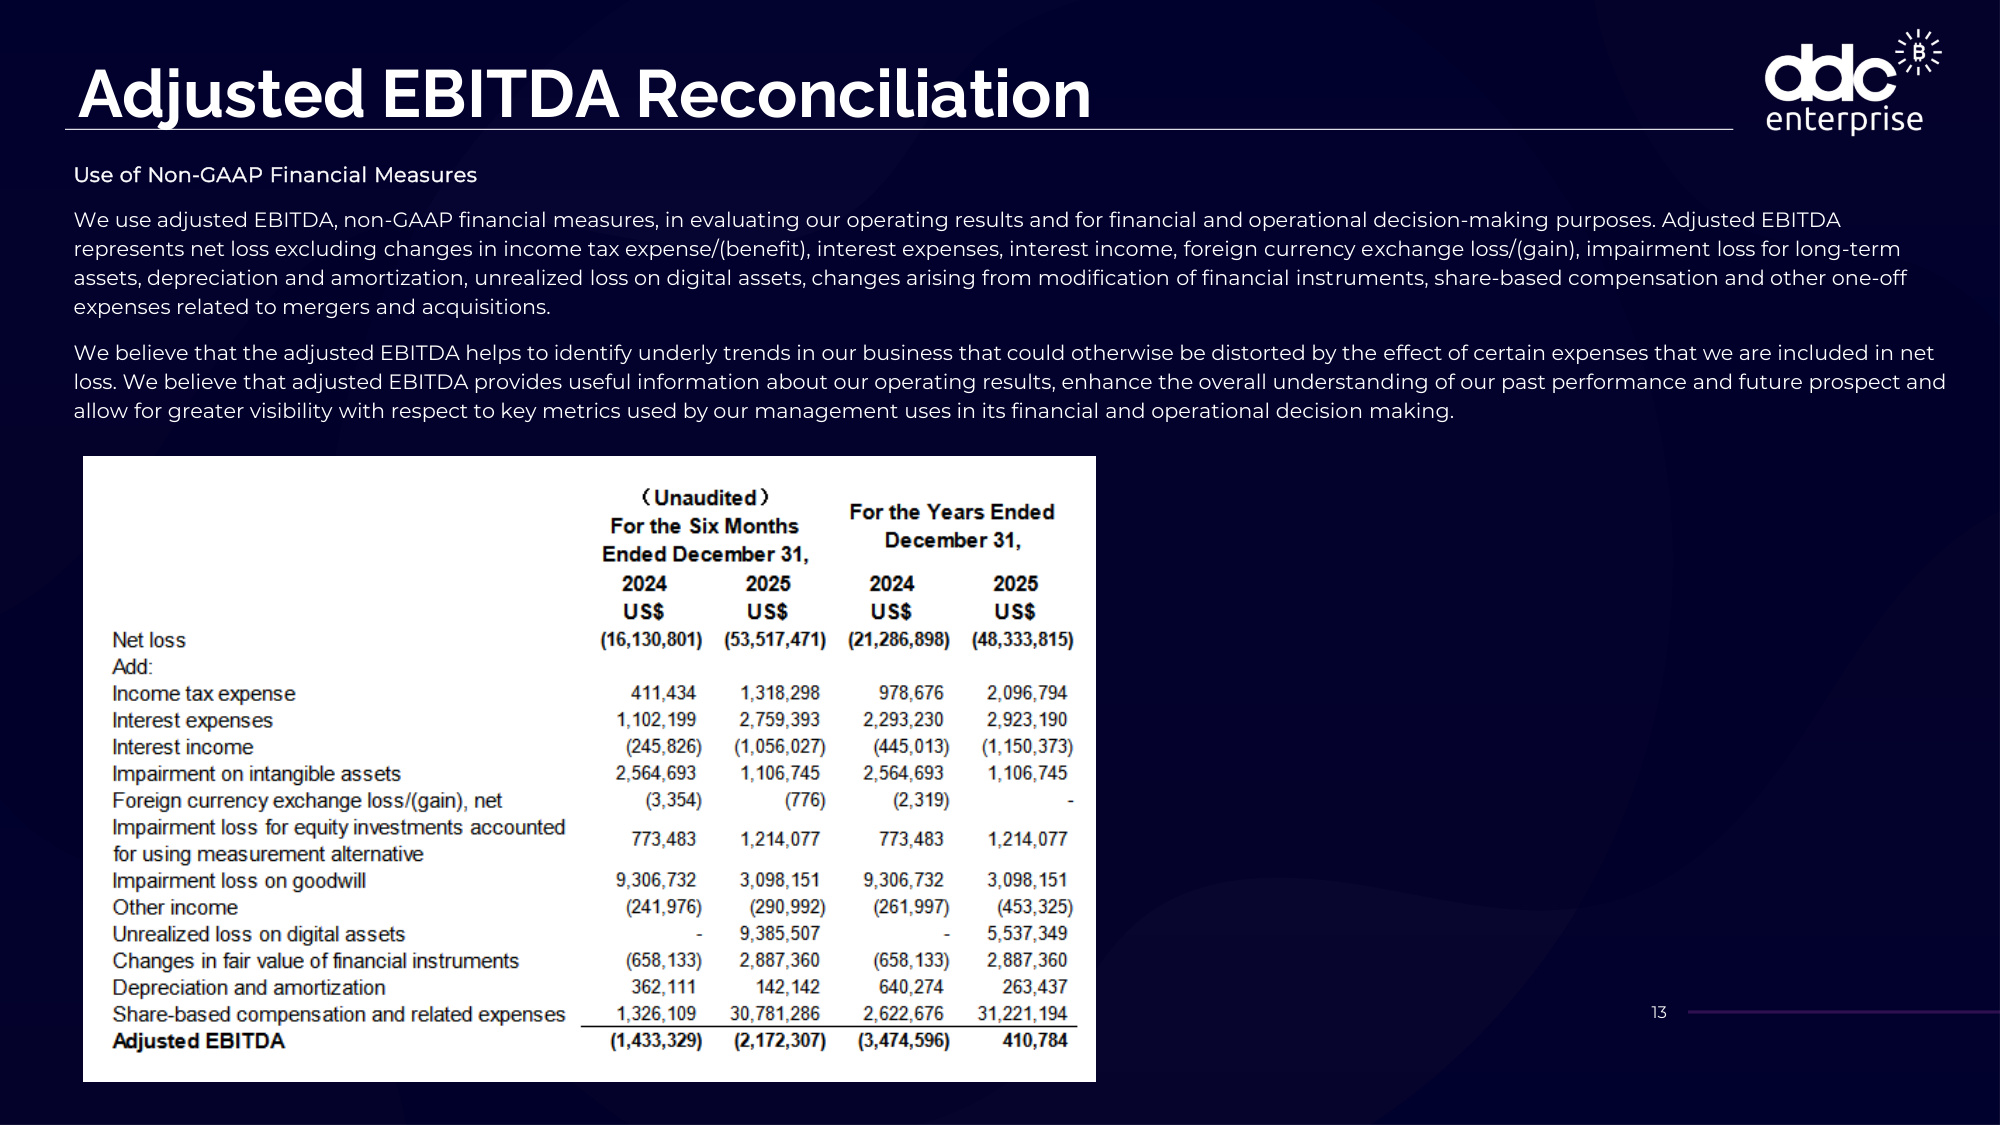
Adjusted EBITDA Reconciliation 13 Use of Non-GAAP Financial Measures We use adjusted EBITDA, non-GAAP financial measures, in evaluating our operating results and for financial and operational decision-making purposes. Adjusted EBITDA represents net loss excluding changes in income tax expense/(benefit), interest expenses, interest income, foreign currency exchange loss/(gain), impairment loss for long-term assets, depreciation and amortization, unrealized loss on digital assets, changes arising from modification of financial instruments, share-based compensation and other one-off expenses related to mergers and acquisitions. We believe that the adjusted EBITDA helps to identify underly trends in our business that could otherwise be distorted by the effect of certain expenses that we are included in net loss. We believe that adjusted EBITDA provides useful information about our operating results, enhance the overall understanding of our past performance and future prospect and allow for greater visibility with respect to key metrics used by our management uses in its financial and operational decision making.

Thank You 14 LinkedIn X